Every visual is drawn for the page it sits on.
Tasvir does not paste stock pictures. For each page it picks the visual the idea needs — a chart, a diagram, a geometric drawing, a formula or an AI illustration — and lays it out with the text.
-
25
chart types
-
17
diagram types
-
LaTeX
geometry and formulas
-
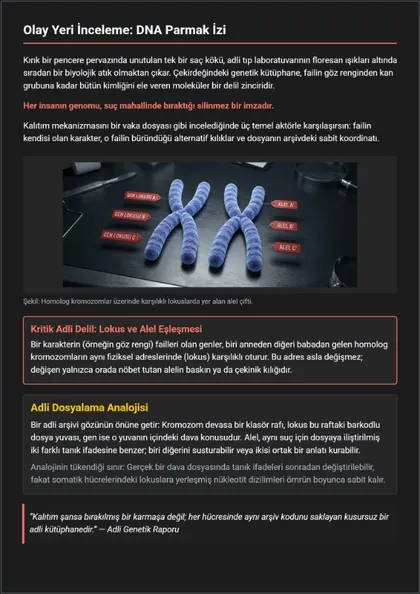
AI
illustrations per page
Taken from real documents
Each of these is the first page of a document Tasvir generated from a single sentence.
25 chart types
Data is written into the page as a real chart with its own axes, legend and labels, so it prints sharp and matches the page theme.
- Bar
- Line
- Multi-line
- Area
- Scatter
- Bubble
- Histogram
- Heatmap
- Pie
- Donut
- Polar area
- Radar
- Stacked bar
- Grouped bar
- Stacked area
- Lollipop
- Box plot
- Funnel
- Waterfall
- Treemap
- Sunburst
- Gauge
- Bullet
- Candlestick
- Bar and line combo
17 diagram types
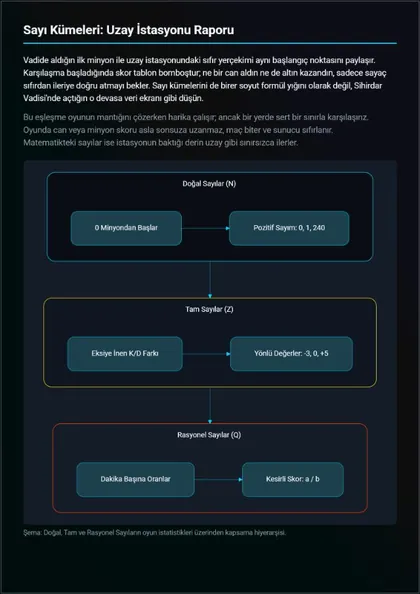
Processes, plans and ideas become diagrams: a kanban board for a project, a mindmap for a topic, a timeline for a history lesson, a gantt chart for a schedule, a sankey for where things flow.
- Kanban
- Mindmap
- Timeline
- Gantt
- Sankey
- Flowchart
- Sequence
- Entity relationship
- Class
- State
- Pie
- User journey
- Quadrant
- Git graph
- C4 architecture
- Block
- XY chart
Geometry and math
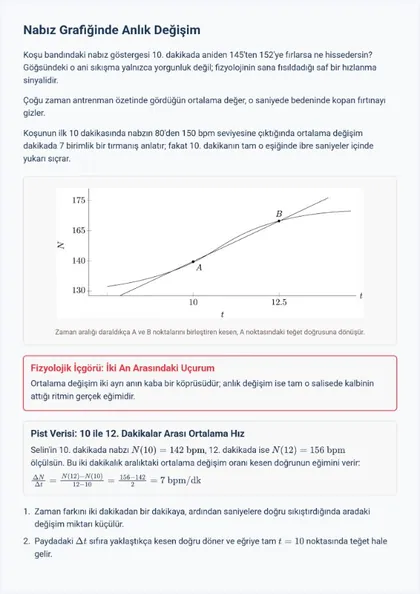
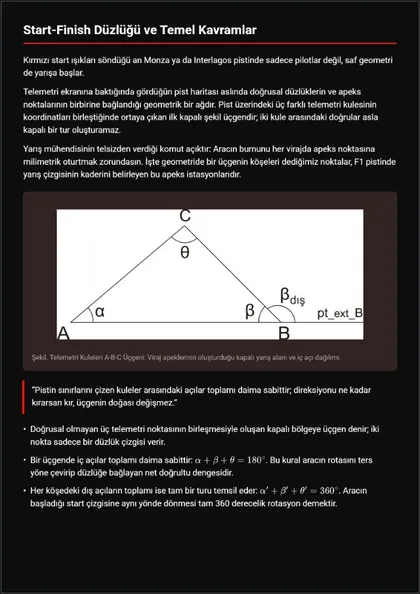
Figures are computed, not sketched: the angles add up, the tangent touches the curve, the point sits on the line.
- Angles
- Arcs and sectors
- Polygons and circles
- Coordinate plane
- Curves and tangents
- Transformations
- TikZ drawings
- LaTeX formulas
Everything else on the page
The same layout engine places the text around whatever the page needs.
- AI illustrations
- Syntax-highlighted code
- Tables
- Callout boxes
- Icons
- Gradients and themes
Two kinds of page
Documents
Fixed, printable pages — A4, A3, A5 or 16:9 slides. The text is measured and paginated so a 50-page study guide prints the way it reads on screen.
Canvas
A free, 1440-wide scene that grows to fit. Turn one idea into a series of up to 25 scenes: a history told as a film storyboard, a science topic as an IKEA manual, a city as a Pokémon card set.
See the canvas showcase →